

A chart is a graphical representation of information in the form of diagram etc. Google provides various free charts to use in applications. They are simple to use and powerful tool to plot diagrams with data. In this article we will talk about how to use some of the Google Charts in Angular application.
Angular Google Charts
Angular Google Chart is a wrapper of Google Charts project built in Angular. It is a package that can be used in the Angular application by installing it using npm.
5 Best Google Charts to use in Angular
- Line Chart– a chart in which information is displayed in the form of data series
- Pie Chart– a circle chart divided into parts to show the information
- Histogram Chart– it is essentially a pie chart with an area of centre cut out
- Gauge Chart– also called a dial chart, uses needles to show the information
- Combo Chart– combination of two or more lines or columns to plot information
Let’s implement each charts in Angular application.
Install Google Charts in Angular
The first thing is to install the google charts library in Angular application so that you can plot various charts.
Note: I am using Angular 12 for this example.
Run the command below to install the angular google charts package:
npm install angular-google-charts
Import GoogleChartsModule
The next thing is to import GoogleChartsModule module in app.module.ts file.
import { GoogleChartsModule } from 'angular-google-charts';

@NgModule({
  ...
  imports: [
    ...
    GoogleChartsModule,
    ...
  ],
  ...
})
export class AppModule {}
Create Service file
app.service.ts
import { Injectable } from "@angular/core";
import { HttpClient } from '@angular/common/http';
import { Observable } from "rxjs";

@Injectable()
export class AppService {
    constructor(private httpClient: HttpClient) {
    }

    getChartData(): Observable<Array<Array<string | number>>> {
        return this.httpClient.get<Array<Array<string | number>>>(`http://localhost:3000/chartData`);
    }
}
I am using json-server to create a fake JSON api.
db.json file
{
    "chartData": [
        [
            "London",
            8136000
        ],
        [
            "New York",
            8538000
        ],
        [
            "Paris",
            2244000
        ],
        [
            "Berlin",
            3470000
        ],
        [
            "Kairo",
            19500000
        ]
    ]
}
Install and run the json server using command-
npm install -g json-serverjson-server --watch db.json
Now we are ready to plot charts. Let’s plot charts one by one.
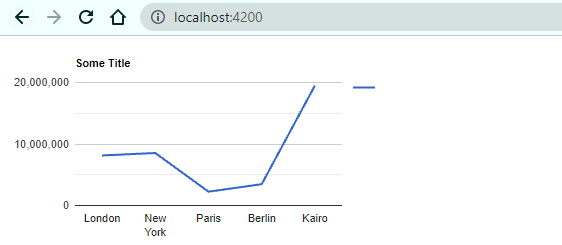
Line Chart
It’s time to plot the chart on page. I have consumed the fake json api (you can use your real api to plot).
import { Component, OnInit } from '@angular/core';
import { ChartType } from "angular-google-charts";
import { AppService } from './app.service';


@Component({
  selector: 'app-root',
  templateUrl: './app.component.html',
  styleUrls: ['./app.component.scss']
})
export class AppComponent implements OnInit {
  title = 'google-charts';
  myType = ChartType.LineChart;
  chartData: Array<Array<string | number>> = [];

  constructor(private appService: AppService) {
  }

  ngOnInit() {
    this.getChartData();
  }

  private getChartData() {
    this.appService.getChartData().subscribe(data => {
      this.chartData = data;
    })
  }
}
Add Template Code
Add below code in your template file. Find the Type values from here: Chart Types
<google-chart [title]="'Some Title'" [type]="myType" [data]="chartData">
</google-chart>
Save the files and run open browser. You will notice following chart on the page.
Pie Chart
Change the Type in component to ChartType.PieChart
myType = ChartType.PieChart;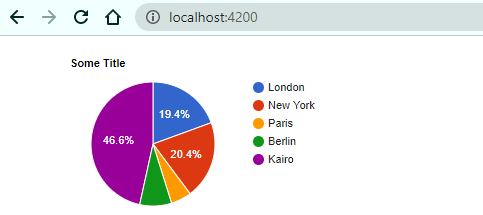
Histogram Chart
Change chartType to Historgram
myType = ChartType.Histogram;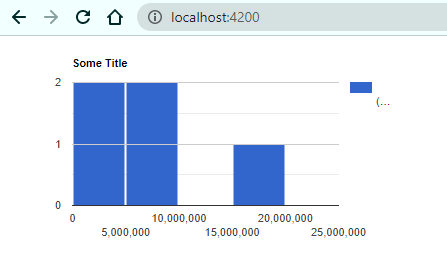
Gauge Chart
Change chartType to Gauge
myType = ChartType.Gauge;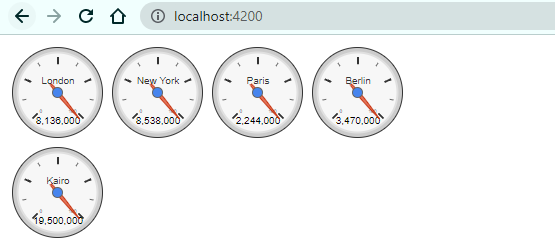
Combo Chart
Change chartType to ComboChart
myType = ChartType.ComboChart;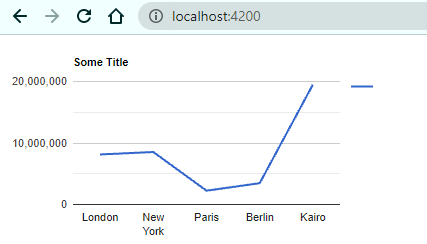
Note: The Combo and Line chart looks similar. The only difference is Combo charts can have multiple charts. As of now I have used only one chart in Combo. You can pass array of multiple data.
Common Errors while using Google Charts
Type '' is not assignable to type 'ChartType'.
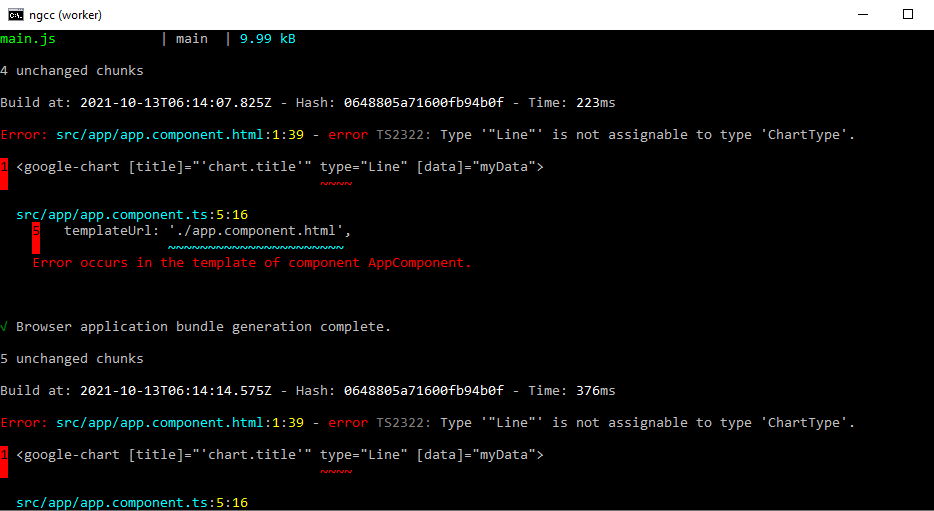
The solution of this error is- do not provide any string chart type. Get the type value from ChartType Enum and then pass it to [type].
// import the Enum
import { ChartType } from "angular-google-charts";

// get chart type
myType = ChartType.LineChart;
Pass the myType variable in template.
Conclusion
The article explains about how to integrate various Google Charts in an Angular application. If you want to optimize your Angular application then I would recommend checking out this article: 5 Best Ways To Optimize Angular For Scaling
Also Read:
Real World Examples of 5 Common Observable Operators
5 Great SEO Ideas To Improve Angular Website Ranking
Angular Material 12 Table, Sorting, Searching & Pagination
RxJS forkJoin: Definition and Real World Uses